Data Visualisation

Our data visualisation services transform intricate spatial data into clear, intuitive visuals that support smarter decision-making. Whether it’s for urban planning, infrastructure development, or asset management, we provide tailored data visualisation solutions that help Western Australian industries interpret and act on their data with confidence.

Gain Visual Insights Into Your Asset

RM Surveys’ data visualisation services provide clear, detailed representations of your assets, enabling better planning, management, and decision-making.

By further integrating digital deliverables and datasets, our customised data visualisation solutions deliver the insights you need to optimise your project outcomes and maximise efficiency.

Visualise your asset’s potential with precision and clarity.

Why Data Visualisation is Essential for Modern Projects

Data visualisation transforms complex information into clear, actionable visuals, enabling industries to make smarter, data-driven decisions and operate more efficiently.

By highlighting trends, patterns, and insights, it enhances decision-making while simplifying communication among stakeholders through interactive data sets, deliverables and models.

Accurate visualisation supports optimised resource management, ensures compliance with regulatory standards, and promotes transparency, reducing risks and minimising disruptions.

Data visualisation empowers industries to turn insights into action, driving success at every project stage.

Data Visualisation Projects

View all projects
project image
1

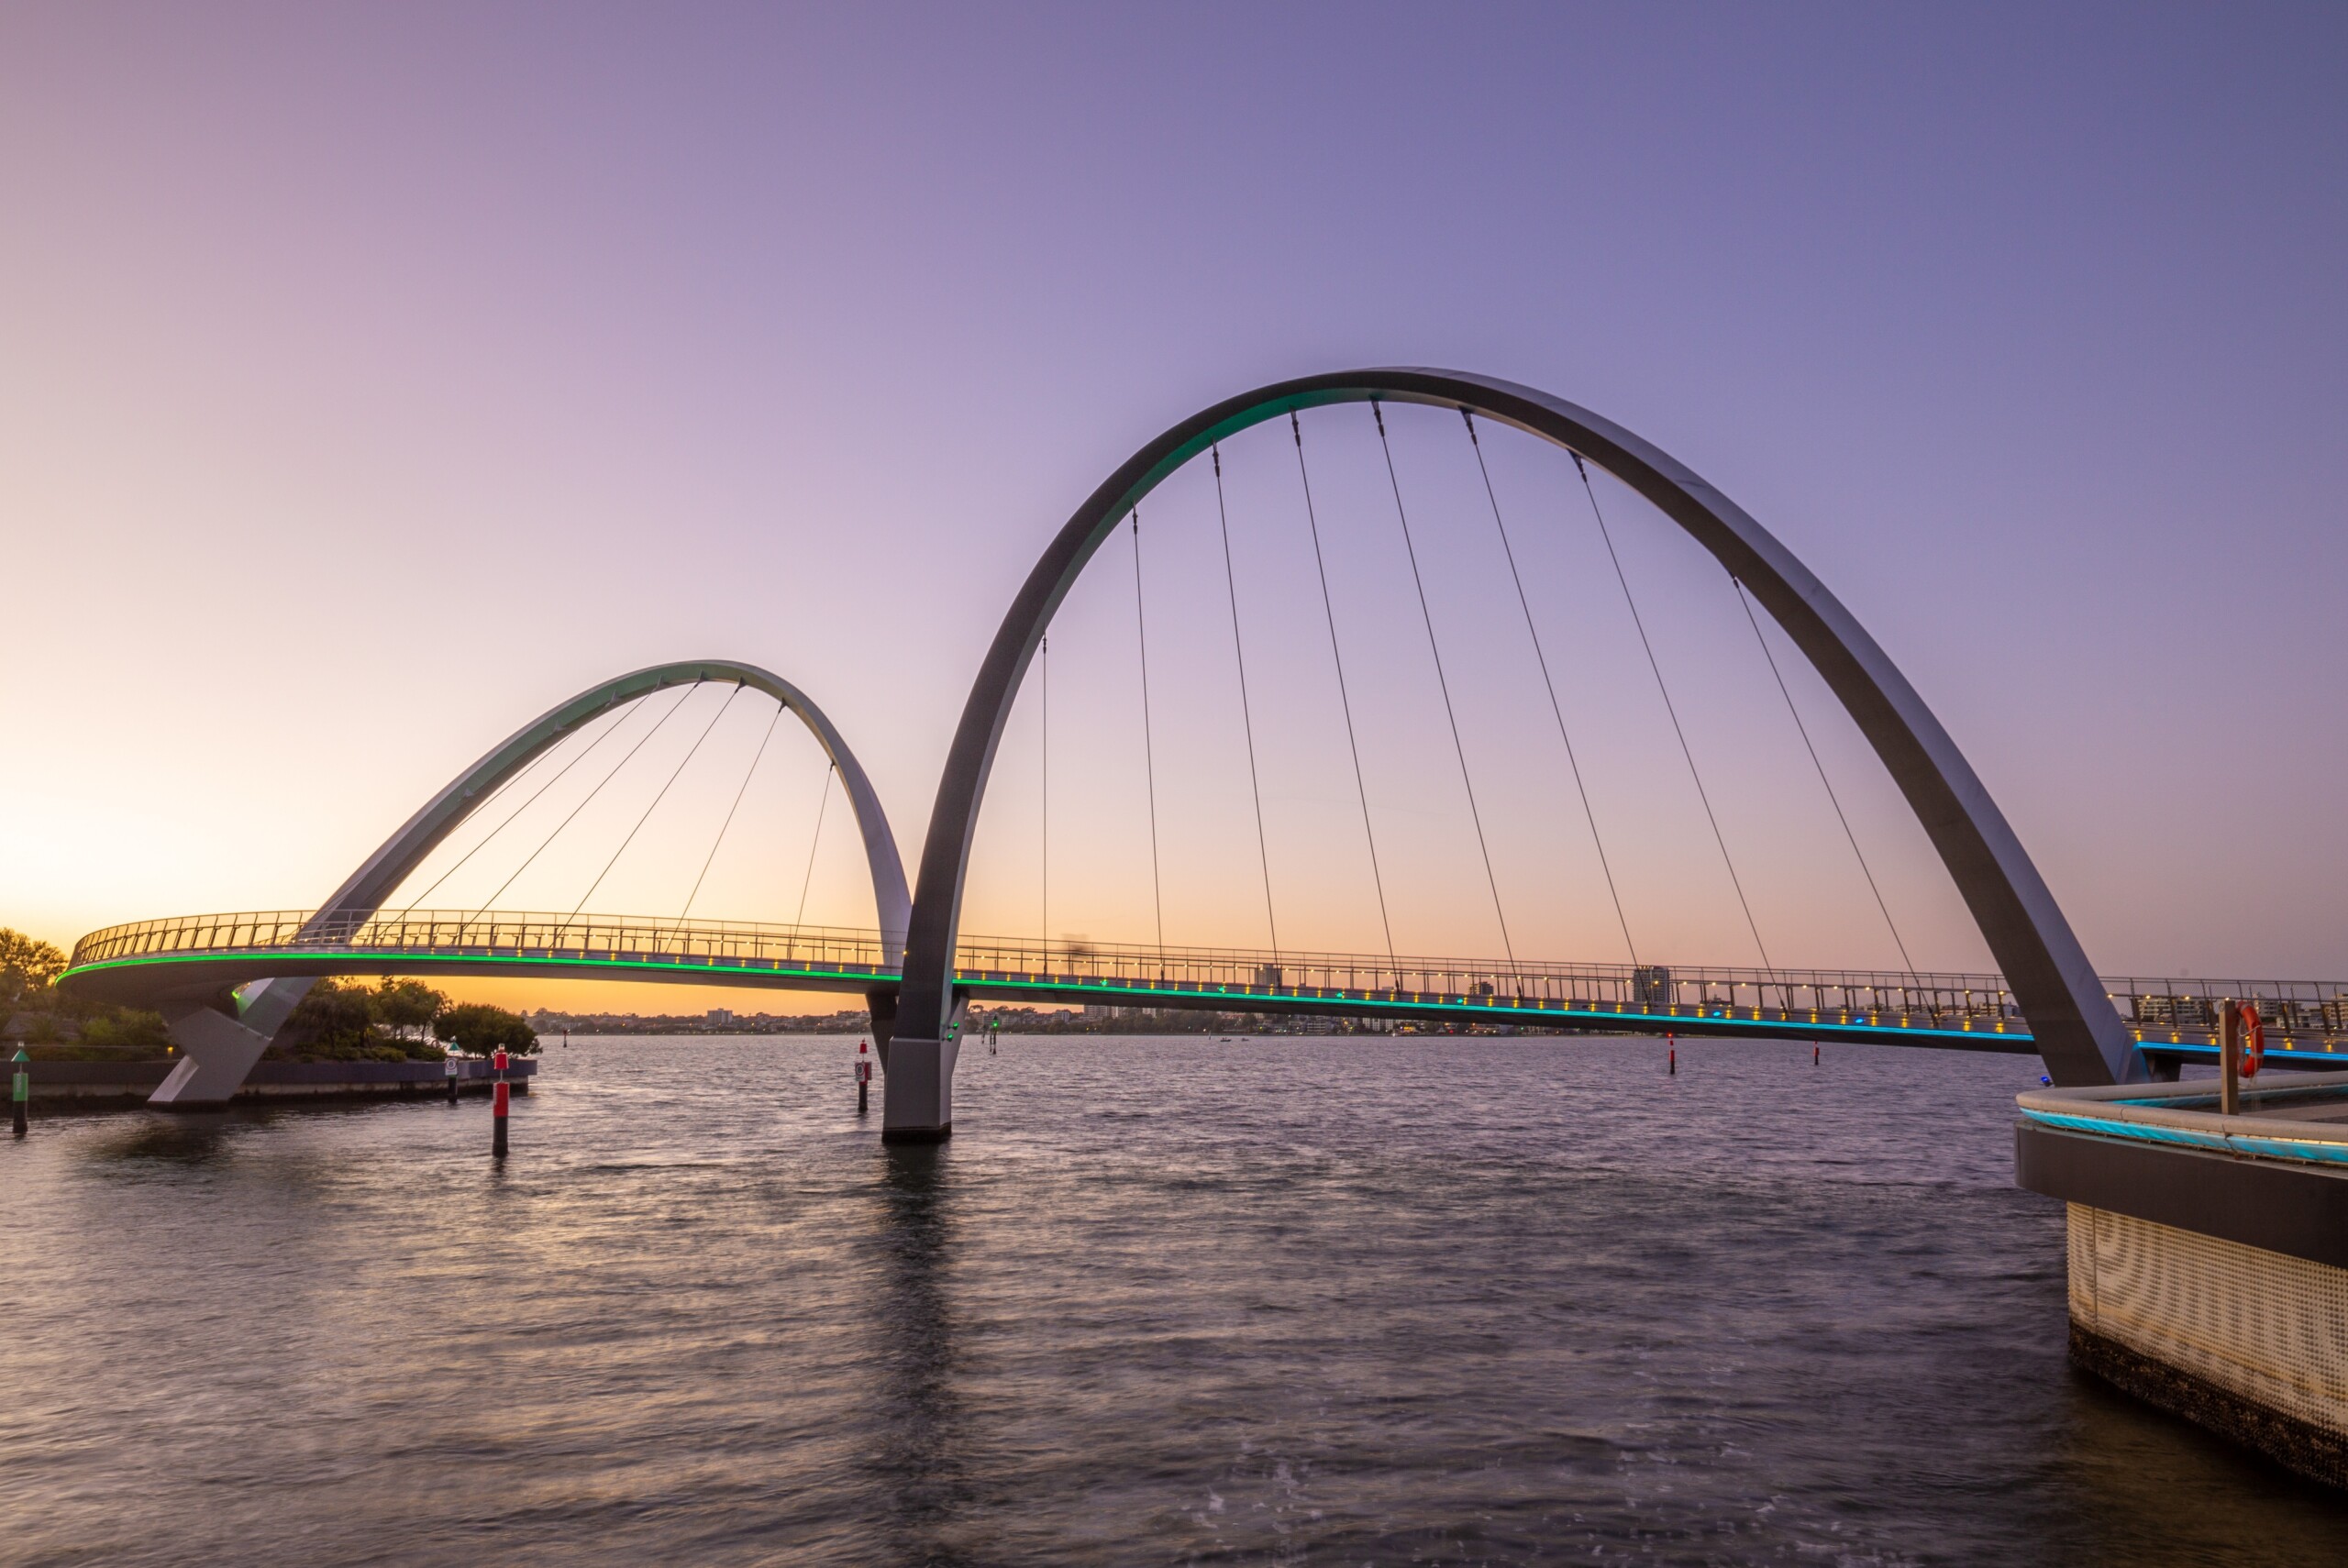
Elizabeth Quay Pedestrian Bridge

RM Surveys utilised advanced data visualisation and precise spatial methodologies to ensure the seamless construction of the iconic Elizabeth Quay Pedestrian Bridge. By transforming complex design data into actionable insights, RM Surveys facilitated the accurate assembly of off-site fabricated components, achieving a flawless fit on-site.

This success demonstrated the power of data visualisation in managing complex infrastructure projects and earned RM Surveys a key role in the Swan River Pedestrian Bridge project.

View more
project image
2

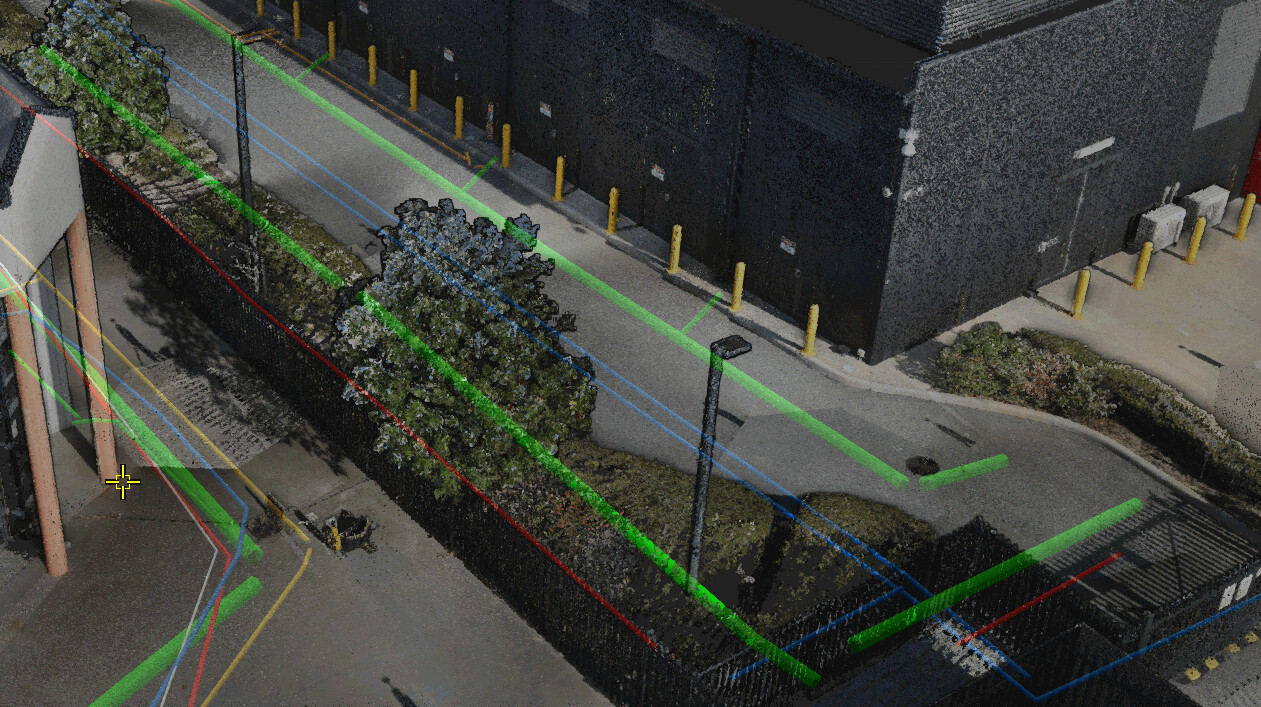
Coogee Chemicals

RM Surveys utilised advanced data visualisation to support the engineering design of new pipe runs at Coogee Chemicals, Kwinana. With no accurate as-built documentation available, RM Surveys conducted precise scans of the 2.5km pipe runs, tanks, and surrounding infrastructure.

Through the creation of a detailed, colourised point cloud, RM Surveys provided clear, differentiated visual data, enabling the consultant to make informed decisions and develop seamless engineering designs. This project highlights the value of data visualisation in overcoming complex challenges and unlocking the potential of industrial assets.

View more
project image
3

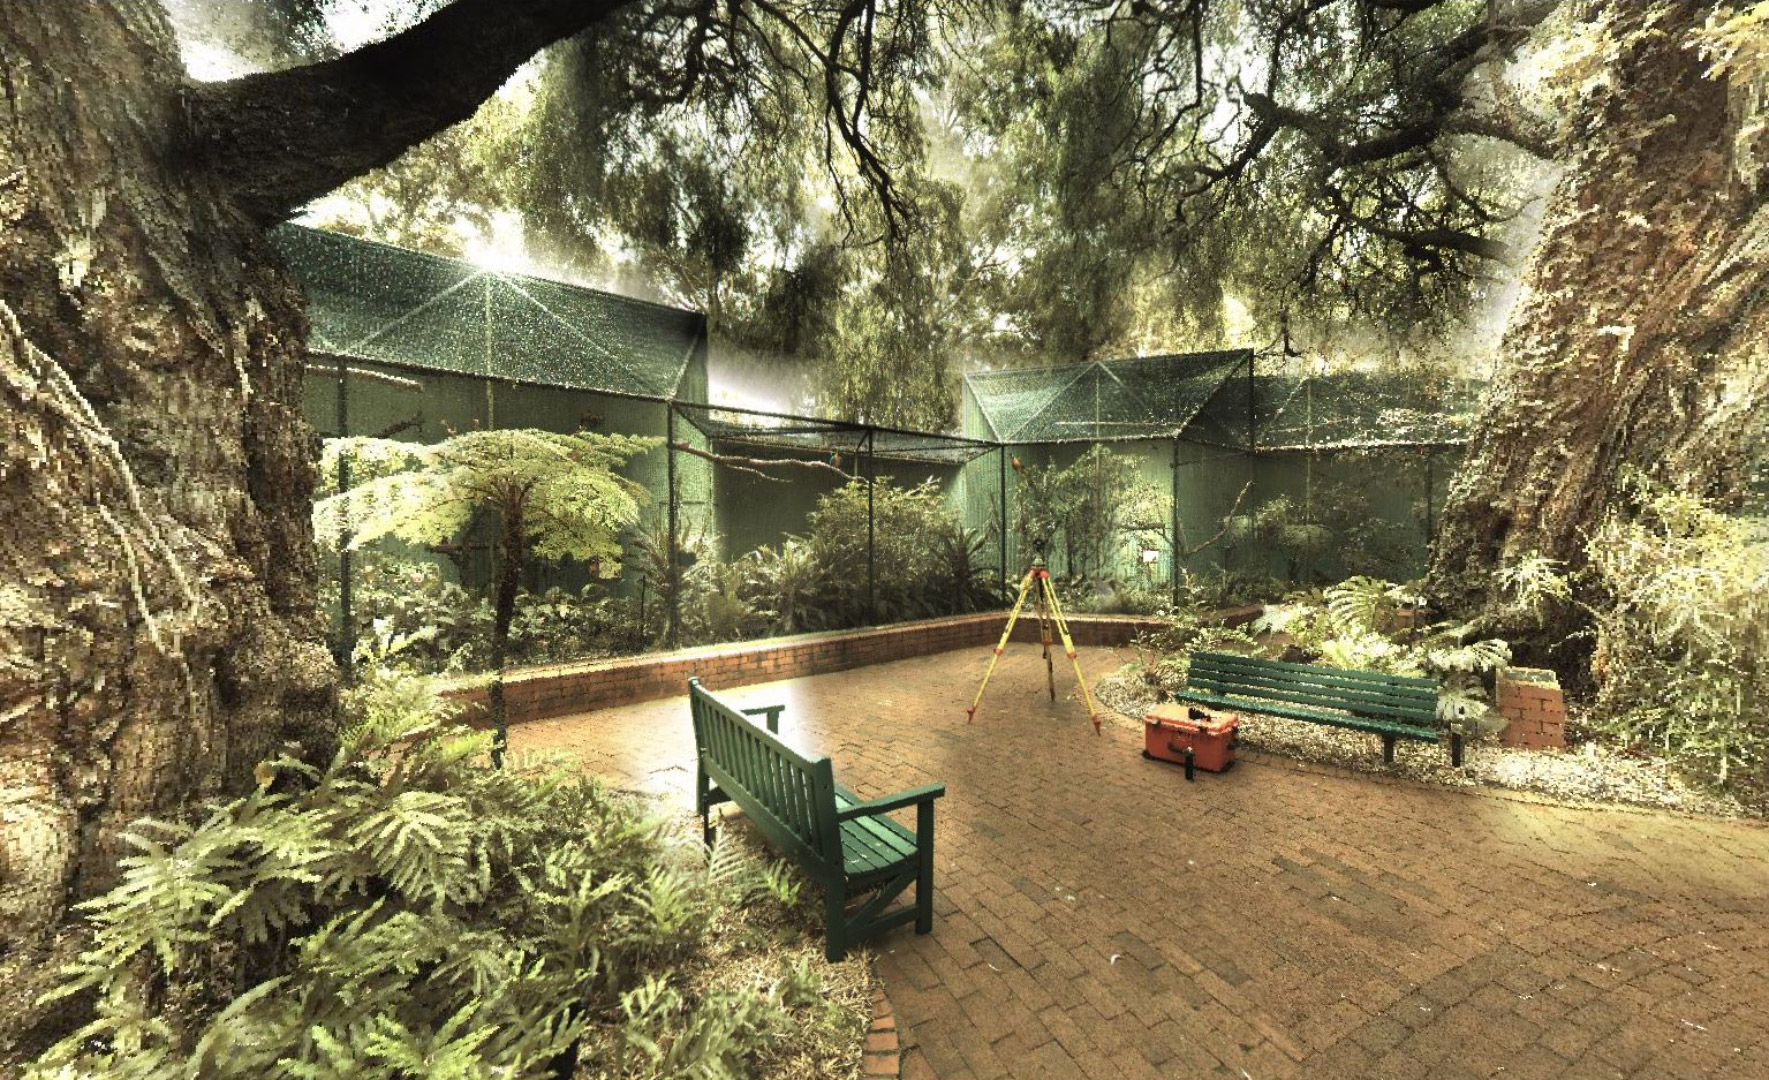
Perth Zoo Enclosures

RM Surveys used advanced data visualisation to support Perth Zoo’s exhibit evolution and redevelopment. By conducting 3D laser scans and creating detailed 3D models, our team provided critical insights into the volume of a large rock for animal use and the layout of the existing African Lion exhibit.

The models detailed contours, services, hardscaping, and structures, enabling precise planning for extensions and redevelopment.

This project demonstrates the power of data visualisation in enhancing design accuracy and facilitating informed decision-making for unique environments like Perth Zoo.

View more
project image
4

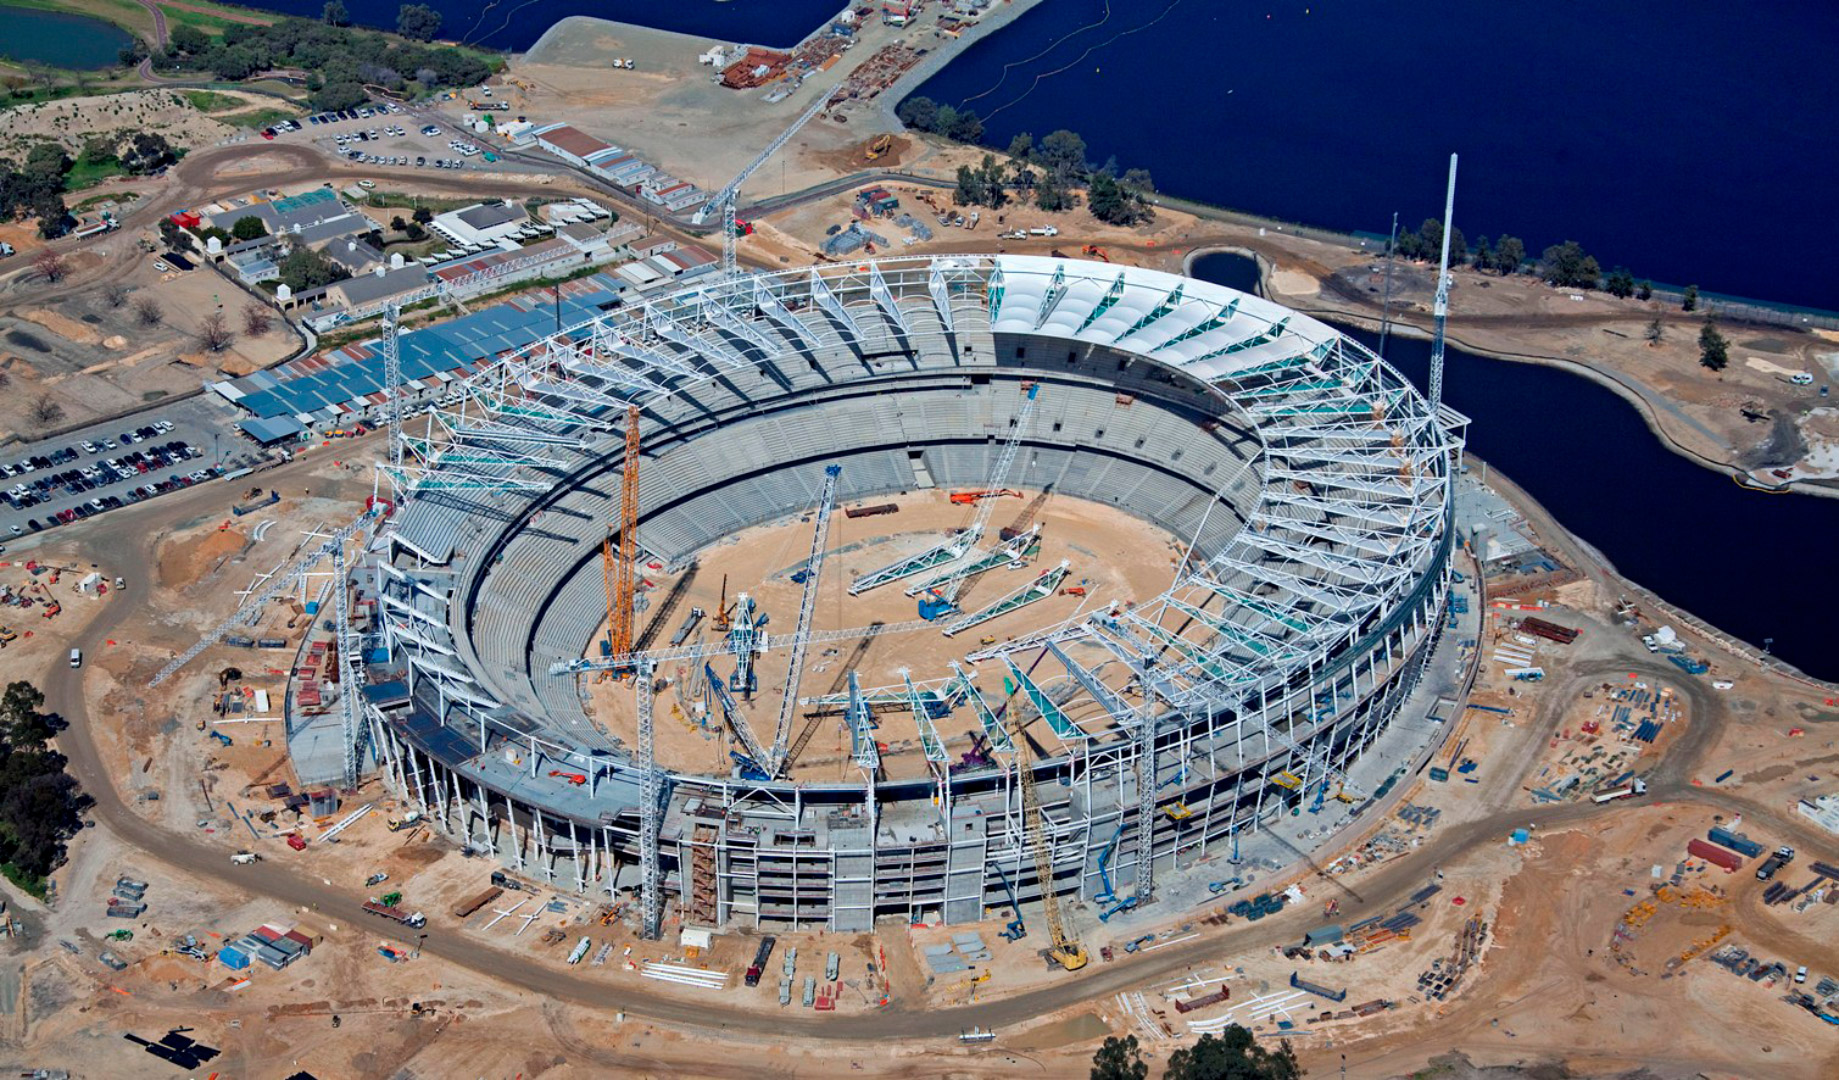
Perth Stadium

RM Surveys utilised advanced data visualisation and BIM technology to support the construction of the 60,000-seat New Perth Stadium.

Providing precise spatial data across all project aspects, RM Surveys ensured seamless coordination, cost-efficiency, and on-time delivery for the 2018 AFL season, showcasing the value of data visualisation in large-scale projects.

View more

Frequently Asked Questions

What is data visualisation in surveying?

Data visualisation in surveying involves transforming complex spatial data into clear, actionable visuals such as 3D models, maps, and point clouds. This makes it easier to analyse, interpret, and communicate information for planning and decision-making.

Why is data visualisation important for projects?

Data visualisation helps stakeholders understand intricate data, identify trends, and make informed decisions. It streamlines communication, reduces errors, and enhances project efficiency by providing a clear picture of the assets and infrastructure involved.

Which industries benefit from data visualisation?

Industries like urban planning, construction, asset management, and environmental engineering benefit significantly from data visualisation. It supports design accuracy, compliance, and resource optimisation across a wide range of applications.

How does RM Surveys deliver data visualisation services?

RM Surveys uses advanced technologies such as 3D laser scanning and BIM to create detailed, tailored visual data. Our expertise ensures accurate, high-quality outputs that align with project goals and stakeholder needs.